South Dade Network Map
A place and its economy mapped as a network and a lineage: towns, people, employers, the Transitway, the Redland, the parks, the gathering places, the plans, the projects and the capital behind them, 1836 to 2026, with Hurricane Andrew as the pivot. The first map on the lineage map engine with no music on it.
Work in progress. This map is not exhaustive. It presents the result of documented research at this release and changes as sources are added, corrected, or superseded. Every node is based on at least one public source and carries its sources and confidence class. If something is missing or wrong, submit it.
Public disclosure policy: This map uses public business records, public corporate filings, property records, public calendars, public civic documents, public press coverage and public listings. It maps commercial infrastructure and documented civic activity, not endorsements, partnerships or private cultural behavior. Inclusion does not require participation, consent or approval. The map corrects factual errors promptly and considers removal requests case by case where a listing is outdated, an entity has closed, publication presents a material safety concern, or the entity is not conducting public facing commercial activity. Public commercial infrastructure is mappable; private cultural behavior is protected.
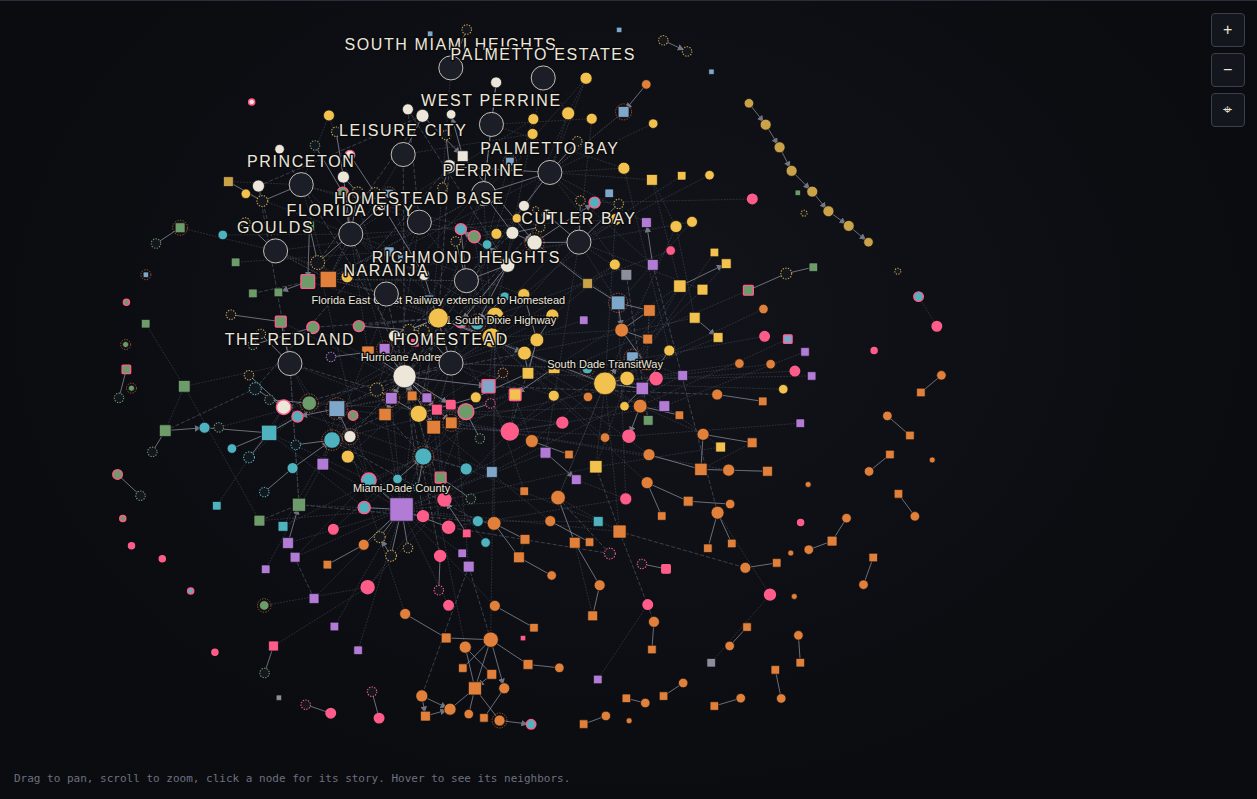 Network view. Three more: Lineage timeline, Cities on a South Dade basemap and 3D, plus a Play animation from 1836 to 2026.
What the map shows
South Dade has many documented destinations and one major historic gathering cluster in downtown Homestead. The mapped pattern is dispersed: 58 documented gathering places, 18 within 600 meters of a Transitway station, 2 clusters of three or more, and 34 standing alone. The map documents fragmentation and uneven concentration; the detection’s argument about belonging remains an interpretation of that pattern.
The population series is the map’s own: the eight ZIP Code Tabulation Areas (ZCTAs) 33030, 33031, 33032, 33033, 33034, 33035, 33170 and 33189 rise from 191,276 in the 2010 Census to 265,396 in the ACS 2020 to 2024 five year estimate. Every figure on this site is computed from the same dataset that drives the map, the PDF and the workbook, and every node carries a year, a source and a confidence grade. 23 nodes carry the Andrew flag because a source records their destruction and rebuilding after August 1992. This site is the evidence layer for the Street Economics® detection A Place to Live, Not Belong. Not Yet. The detection makes the argument; the map, the reference, the PDF and the dataset carry the evidence, public documents only.
Read the reference
The same text as the PDF, generated from the same data file as the map, so the counts never disagree.
Current cases: how a place gets made
Six cases singled out because each shows a different mechanism behind the detection’s argument. Node size and centrality are computed, not adjusted.
Ten layers of the place
Every node belongs to one layer, the one that best describes the part of the place it sits in. Open any layer in the index of nodes.
Most connected in this dataset
Betweenness on the full graph: the nodes that bridge otherwise separate parts of the map. Full table and method.
- Miami-Dade Countyagency · betweenness 0.145
- Hurricane Andrewevent · betweenness 0.107
- Florida East Coast Railway extension to Homesteadroad · betweenness 0.084
- South Dade TransitWayroad · betweenness 0.074
- US 1 South Dixie Highwayroad · betweenness 0.059
- Miami-Dade Parks, Recreation and Open Spacesagency · betweenness 0.056
- Downtown Homesteadplace · betweenness 0.054
- Homestead Community Redevelopment Agencyagency · betweenness 0.039
Data and downloads
The PDF reference, the Excel dataset and data.json, with the rules, the evidence standard and how to cite, on the data page. Corrections and additions go through the submission form.